Farmland and Food Investments – Where next?
Fri 01 Sep 2023
Following on from record profitability in major markets during 2021 and 2022 – land markets in many parts of the world reached all time highs. A number of the trends driving those market highs have now reversed or at least declined and the question therefore is where next ?
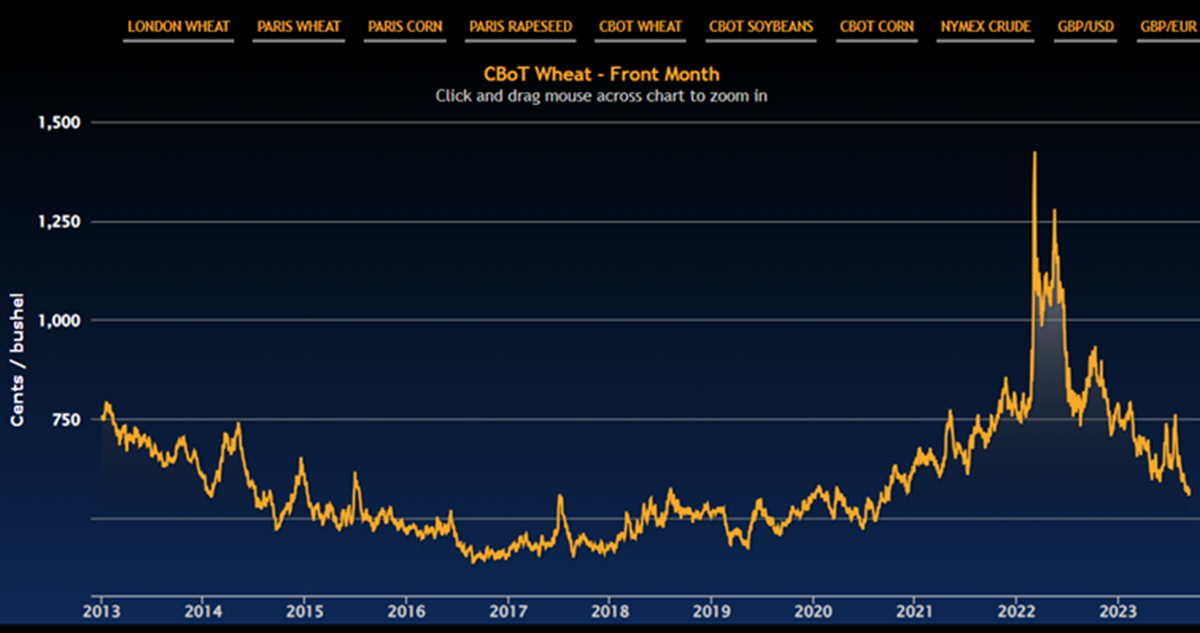 Fig 1.1: CBOT Wheat Cents/ bushel. Source: https://www.noggersblog.co.uk
US Farm sector income saw a huge 20% increase in 2021 compared to 2020 on the back of rising commodity prices due to supply chain constraints and increased demand (partially) coming out of COVID. Then in 2022 an additional increase in income of a further 20% largely as a result of supply side pressures due to the Russia-Ukraine war – brought Net Farm Income (NFI) to a record high US$183 bn.
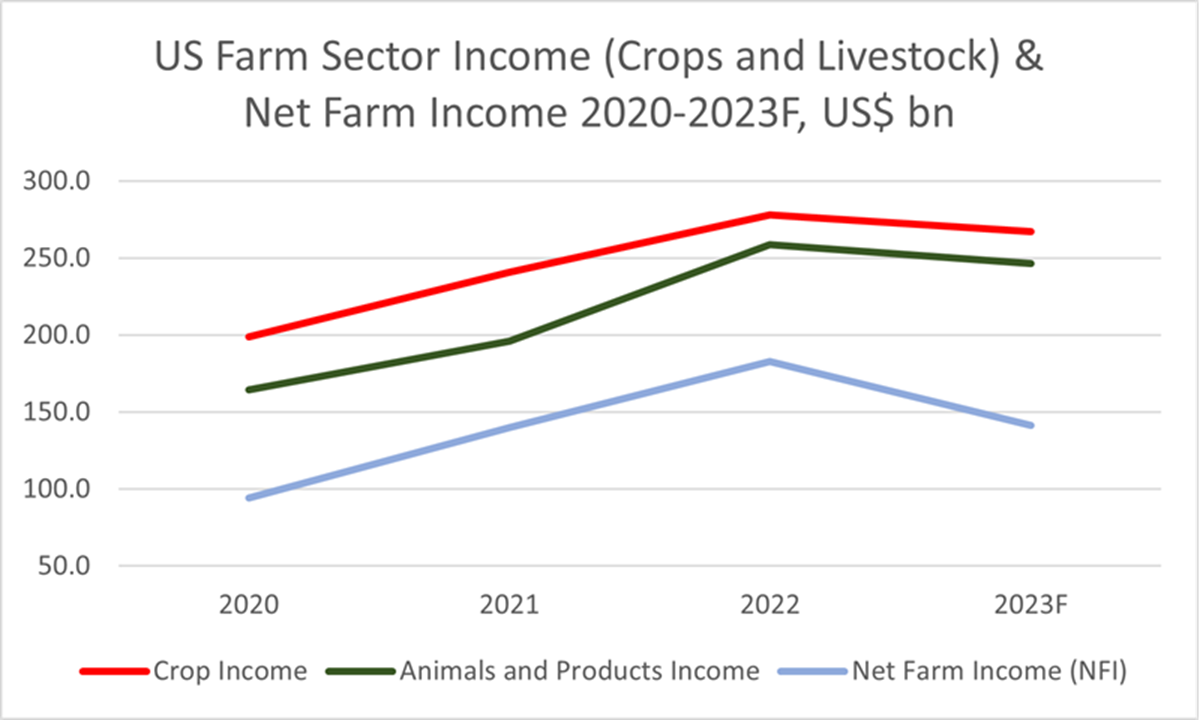 Fig 1.2: 2020-2023 US Farm Sector Income & Net Farm Income (NFI) (USDA)
To put this in context – the NFI in 2019 was US$79bn – so the $183bn three years later represents an increase of 131%. Whilst costs have increased very significantly – income has outstripped cost inflation certainly up to and including 2022. The forecast NFI number for 2023 represents a drop compared to 2022 but is still a historical high at US$141bn.
With all this cash in the system, cash rents have unsurprisingly headed northwards with the corn belt seeing an increase in cash rents of 8.3% in 2022 and a further 5.8% in 2023.
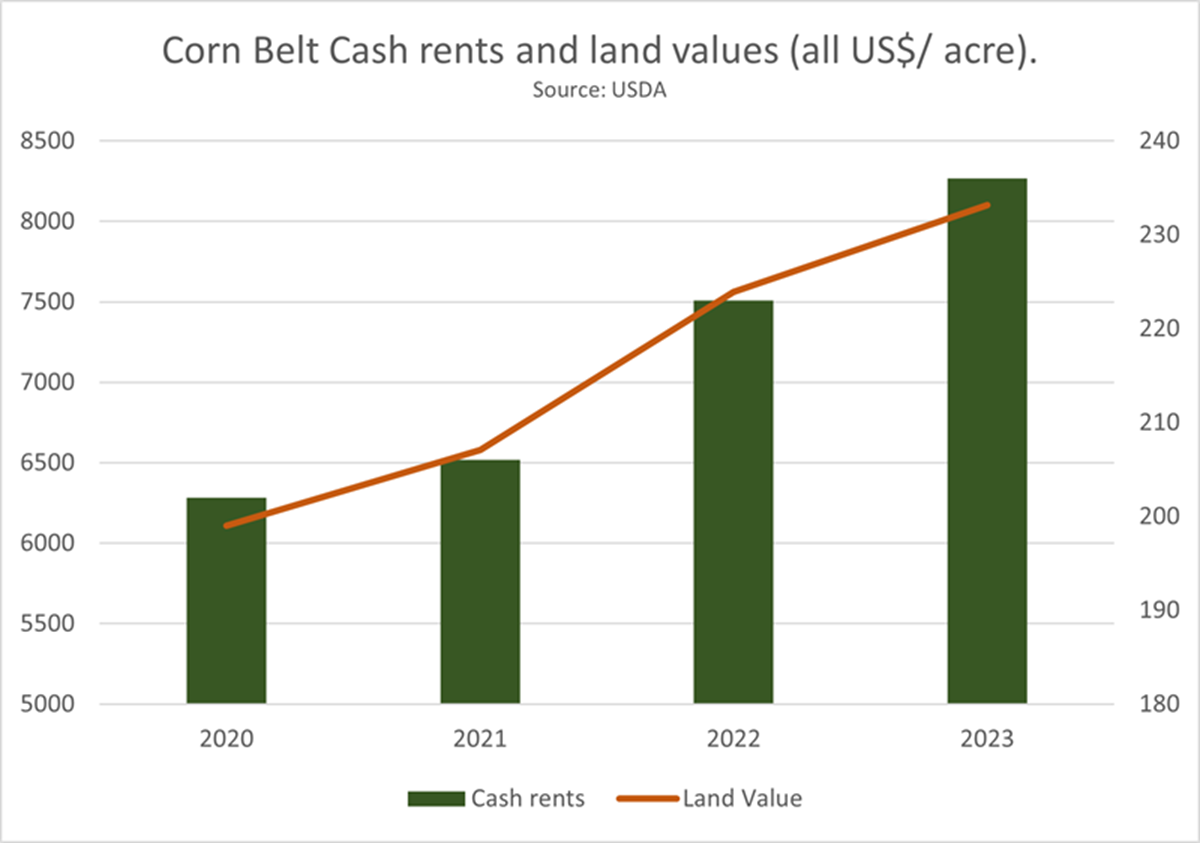 Fig 1.3 Corn Belt Cash rents and Land Values (US$/ acre). Source: USDA.
The corn belt land market has moved to new heights with a significant 14.9% increase in 2022 and a further 7.1% in 2023. That means a 23% increase in values over two years underlining the performance of farm land in times of high inflation. To add a bit more colour to this the number of farms in Iowa in 2020 that were sold for $20,000/ acre or more was zero. In 2021 16 farms were sold for more than $20,000 acre and in 2022 that number rose to 50.
More Dollars chasing fewer farms
Within the context of c. 7-8 farms out of 10 being purchased by farmers – this means more dollars are chasing the same amount of land. Yield compression has occurred and we are now seeing sub 3% consistently on new acquisitions.
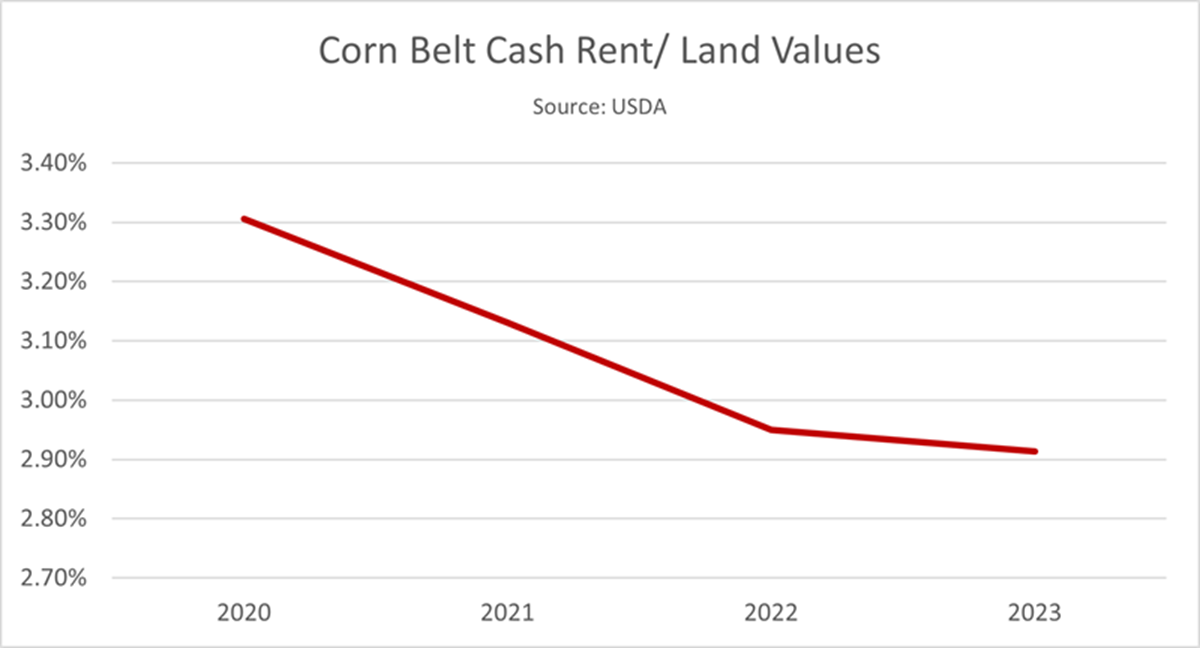 Fig 1.4 Corn Belt Gross Returns (Cash rents / Land Values). Source: USDA.
With commercial interest rates at c. 7-8% this doesn’t add up which means cash reserves are being used (or at least a greater proportion of cash vs. debt) by farmers and other investors are seeing the asset class as a safe haven in inflationary times.
Australia – values pushing higher but sensitivity on climate exists
Australia farm land values continued to firm in 2022 and the national median price per ha increased 20% to A$8,506 per ha (approximately US$ 2,216/ acre). The previous year (2021 vs 2020) also saw a c. 20% increase and whilst the increase across States was highly variable the overall impact at national level was remarkably consistent with other developed land markets.
As with all markets higher commodity prices in 2021 laid the foundation for an upward movement and this continued into 2022 but demand has softened recently on the back of commodity prices weakening. Confidence was also buoyed by stong rainfall and La Nina events led to a third consecutive year of above average rainfall.
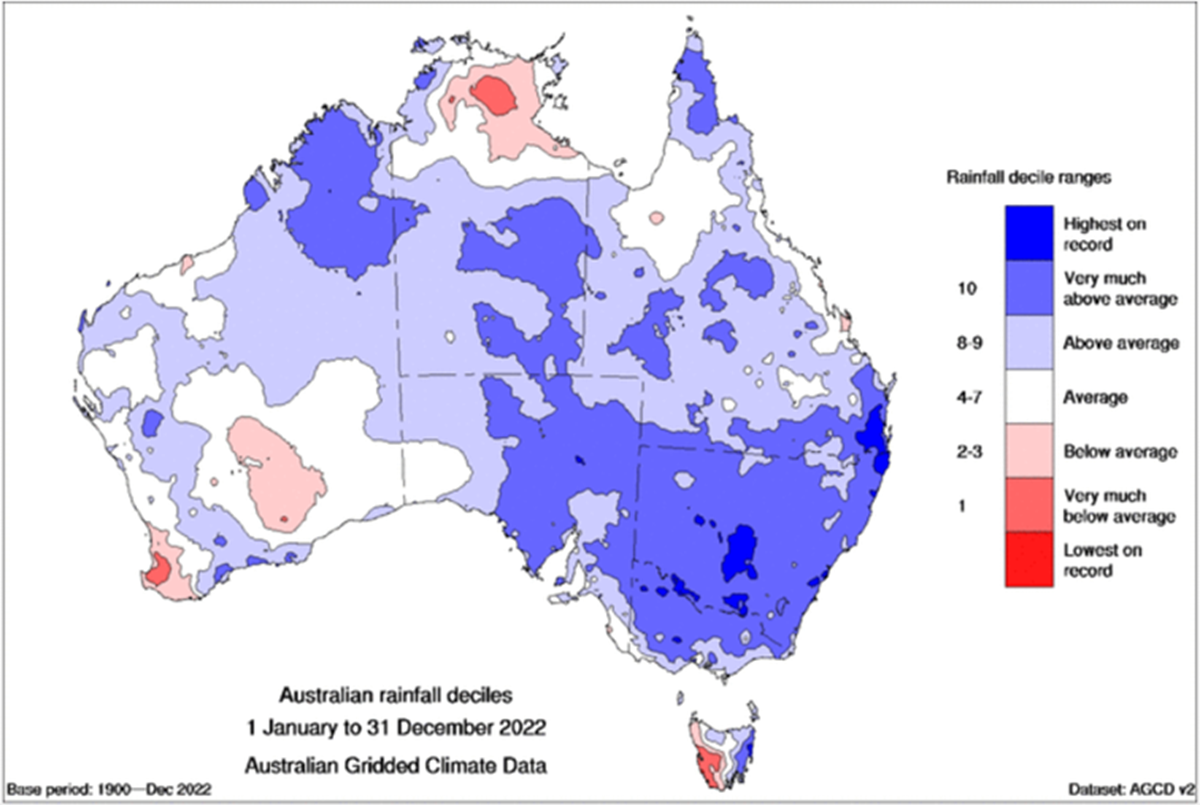 Fig 1.5: 2022 Rainfall in relations to long term average. Source: BOM Australia
Higher yields – from the previous two harvests plus high commodity prices therefore provided the suport for a strengthening land market. This increased confidence and demand was then brought further into focus by a reduction of land on the market and ultimately a 34% reduction in transactions through 2022 (Source: Rural Bank).
Climate & Water Sensitivity
Agricultural markets and therefore Net Farm Income is increasingly impacted by climate events and weather patters and this is seen perhaps more keenly in Australia than any other developed market. Strong rainfall has a disproportionate impact on incomes which often then feeds directly (with a multitude of other factors) into confidence (or otherwise) in land markets and results in strengthening land markets. Equally the opposite is true. Australia is particularly vulnerable to the impacts of climate change and the Government’s State of the Climate report 2022 reported the climate has warmed by an average of 1.47 C since records begain in 1910 and there has been a decline of around 15% in April to October rainfall in the southwest of the country since 1970 and a decrease of 10% in the southeast in the same April to October period.
Extreme weather events are increasing and this together with shifts in long term weather patterns is likely to further increase income volatility going forward.
Interest rates key but not quite as impactful on the farm sector as they once were
With multiple increases since April 2022 the Reserve Bank of Australia (RBA) rate is currently at a very significant 4.10% meaning commercial interest rates are running at 8-10%. However, the level of debt in the sector remains relatively low.
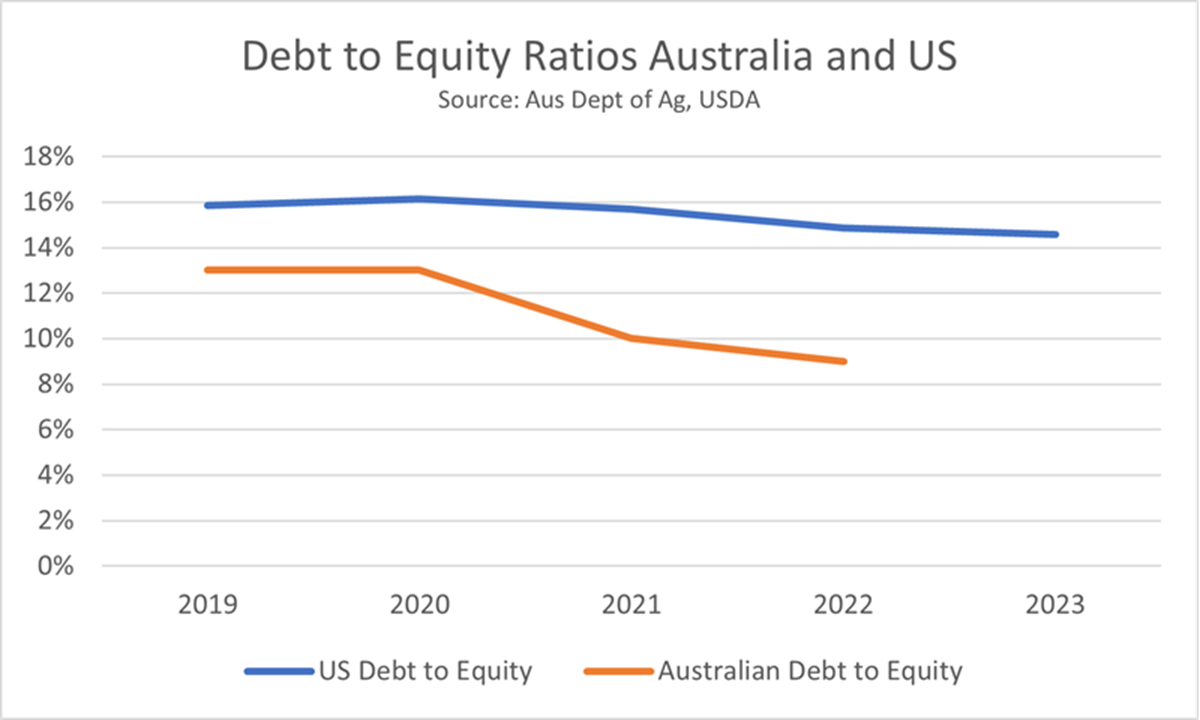 Fig 1.6: 2019-2023 Debt to Equity ratios for Australia and U.S. Farm Sectors.
Whilst the overall aggregate lending in Australia increased in 2021-22 by 9% the average proportion of farm cash income consumed by interest payments has trended down in recent years due to higher farm incomes and lower interest rates. In 2021-22 the average proportion of income consumed by interest payments (broadacre and dairy farms) was 8% - a historical low. It is perhaps reasonable to assume that whilst interest rate hikes are causing significant pain for individual business’ – at an aggregate level there is a considerable cushion to absorb these higher servicing requirements due to higher incomes and increased equity.
Inflation is key and may not fall quite as fast as some commentators are suggesting leading to an interest rate hangover and further cost push on the input side
So where does this leave markets looking forward. There is little sign of the war in Ukraine abating. Indeed it appears Russia is trying to do everything it can to choke off Ukraine’s access to any kind of Black sea route to market. The markets appear to have priced that in for the time being but with 23/24 global wheat production forecast at 793 MMT and coarse grains at 1,497 MMT – closing stocks are looking like they will increase fractionally (1%) for the 23/24 marketing year. This all assumes there are no supply side shocks which of course given the climate events observed over the last two years, seems optimistic.
There is an argument to say inflation – and by extension interest rates, could be more persistent that many expect. Oil prices are expected to exceed $100 a barrel this year on the back of OPEC reducing supply and that does not bode will for inflation coming down quickly to central banks target rates of around 2%. With oil currently trading at a ten month high this is going to have implications for fertiliser prices and crop protection products and the current wage-price spiral plus climate change (disrupting supply side) are often quoted as other reasons why inflation may not fall quite as dramatically as has been suggested. De-globalisation or the economic cold war is leading to to businesses’ seeking to reduce exposure to foreign supply chains which will put more pressure on in-country supply chains.
Good reasons exist therefore to think that current inflation could be more difficult to bring under control than certain policy makers think and may extend over several years. If this turns out to be true, it may be that interest rates have returned to a more normal level compared to the decades long period of near zero interest rates. The impact of this may be to cool land markets somewhat, which can only be a good thing in the long run to avoid a bubble. However, the fundamentals of strong farm incomes globally, increased interest from investors seeking to hedge against inflation and diversify portfolios means we are likely to see strong ongoing demand for land. We may not see 15% growth per year (in developed markets, developing markets will be different) which is unsustainable but perhaps a return to the long run 3-5% capital growth per annum the sector has become used to – is more likely.
